1. Data Collection
Source & Method
Antarctic penguin population database (Static)
Population census records for Gentoo, King, and Macaroni penguins were sourced from MAPPPD (penguinmap.com), the world's only open-access Antarctic penguin database. Data was downloaded directly via the MAPPPD portal and loaded dynamically using a Python caching function that re-fetches from the live source when needed.
Antarctic penguin population database (Static)
We used the Antarctic Penguin Population Database (MAPPPD) from SCAR/penguinmap.com, downloading colony-level records (species, latitude/longitude, population counts/breeding pairs, year, and survey-quality metadata) directly from the site.
Antarctic Sea Ice Extent (Static)
Antarctic Sea Ice Extent (Static) was sourced from the National Snow and Ice Data Center (NSIDC), NASA. The data is available at NSIDC Antarctic Sea Ice Monthly Data.Data was directly downloaded as CSV files containing monthly sea ice area measurements from 1979 to 2025.
Climate Data Online (API)
Average temperature data was collected from the NOAA Climate Data Online (CDO) API. A personal NOAA API token was obtained and included in the request header to authenticate API calls. Using Python and the requests library, a query was sent to the CDO endpoint specifying the dataset (GHCND), temperature datatype, location, and date range. The API returned the data in JSON format, which was then parsed and converted into a Pandas DataFrame for cleaning, aggregation, and analysis.
Why This Source?
Antarctic penguin population database
We chose this source because it is a specialized, open-access, authoritative Antarctic penguin repository with the exact spatio-temporal and location fields needed to analyze penguin population patterns and compare species across regions and years..
Antarctic Sea Ice Extent (Static)
NSIDC provides authoritative, well-maintained Antarctic sea ice datasets collected via satellite observations. This dataset is relevant to our research as it provides long-term temporal coverage (1979–2025) and high spatial resolution, enabling robust analysis of trends and variability in Antarctic sea ice extent.
Climate Data Online (API)
The NOAA temperature dataset is relevant to the research questions because it provides reliable, long-term observational climate data collected from official monitoring stations. NOAA is a trusted scientific authority, ensuring the data is accurate, standardized, and consistently recorded over time. This allows for meaningful analysis of temperature trends, seasonal patterns, and climate variability, which are essential for investigating changes in climate conditions and answering the research questions related to temperature behavior over time.
Dataset Overview
2. Cleaning & Preprocessing
Missing Values
Antarctic penguin population database
65 pre-1979 records were removed as MAPPPD systematic coverage only begins then, along with 2 missing counts, 28 zero-count entries, and 438 duplicate site-year records. Outlier detection using 3×IQR flagged 9 Gentoo and 13 Macaroni surveys as extreme values without removing them, preserving data integrity.
Antarctic penguin population database
Essential fields for analysis were: penguin_count, date, latitude_epsg_4326, longitude_epsg_4326.
Rows missing any of these were removed, because they prevent time-series analysis, mapping, and count-based comparisons.
The dataset has separate date columns (day, month, year). Some records had a missing day, so we imputed missing day with 1 to construct a valid date (documented assumption: day-of-month is not critical for our year/month level analysis).
Antarctic Sea Ice Extent (Static)
The data cleaning impact chart above summarizes the preprocessing results. The dataset initially contained missing values which were removed during cleaning, resulting in a complete dataset with no remaining null entries. Duplicate records were also checked, and no significant duplicates remained after validation.
Climate Data Online (API)
The dataset is very comprehensive with no missing data.
Duplicates & Inconsistencies
Antarctic penguin population database
Standardize text fields (common_name, count_type, site_name, etc.) by removing whitespace and converting to lowercase to ensure that the same category is not treated as different.
Eliminated duplicate rows using a reasonable key (site, species, date, count_type, vantage, penguin_count, etc.) to ensure that aggregated results are not skewed by duplicate counts.
Antarctic Sea Ice Extent (Static)
Duplicate detection was performed using the core time variables (Year and Month) along with the measurement fields. As shown in the cleaning impact chart, the dataset contains only unique records after preprocessing, ensuring consistency for analysis.
Climate Data Online (API)
Unnecessary columns such as datatype, station, attributes, and value were removed to retain only relevant variables. The temperature values were standardized using a z-score transformation to normalize the data and allow easier comparison across observations. Additionally, a temperature anomaly was calculated by subtracting the average temperature for each month from the observed temperature, which helps identify how much warmer or colder each observation is relative to the typical seasonal temperature.
Outlier Detection
Antarctic penguin population database
Removed invalid counts where penguin_count < 0.
Flagged extreme values during EDA using boxplots and log transformation. (We did not blindly remove high values because large colonies can be legitimate; instead we inspected them via site-wise summaries.)
Outliers were examined using distribution analysis. The histogram compares the sea ice extent distribution before and after cleaning. Since the distributions appear nearly identical, the cleaning process preserved the underlying data patterns while removing inconsistencies.
Transformations Applied
Added log_count = log(1 + penguin_count) to reduce skew and make distributions/relationships easier to visualize and model.
3. Statistical Analysis
Summary Statistics
Antarctic penguin population database
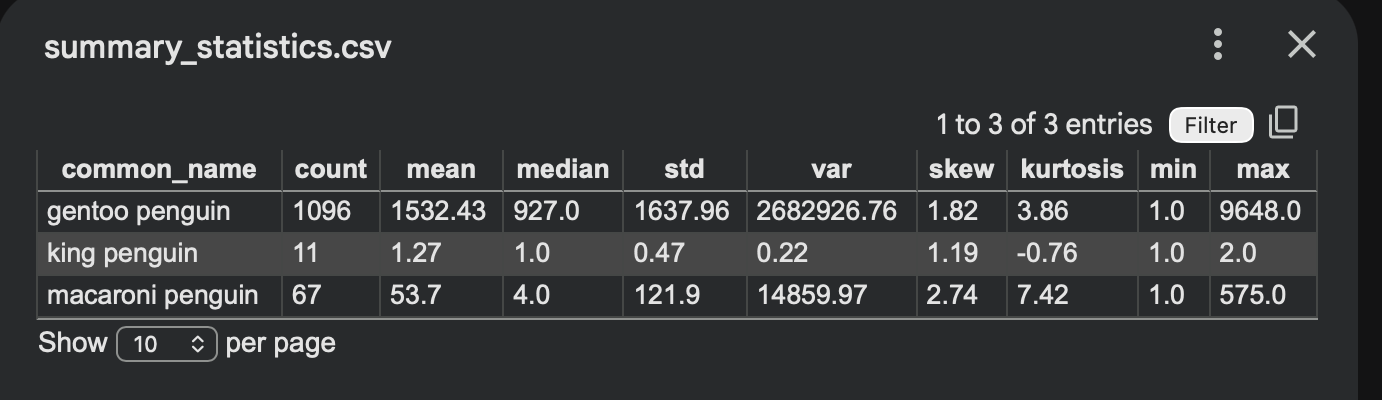
Gentoo dominates with 1,096 records and a mean count of 1,532 per survey, while King penguin has only 11 records — a significant imbalance worth noting. A Kruskal-Wallis test confirms the three species differ significantly in count distributions (H=187.66, p<0.0001), and annual totals show King and Macaroni are strongly correlated (r=0.918) while Gentoo behaves independently.
Antarctic penguin population database
The cleaned dataset contains 2,494 records across three species (Adélie 1,330, Chinstrap 1,073, Emperor 91). For all species, the mean is much higher than the median, showing a strong right-skew due to a few very large colony counts (max up to 504,332). Data is mostly complete; only day has notable missingness (22.5%) and vantage has minor missingness (4.6%).

Antarctic Sea Ice Extent (Static)
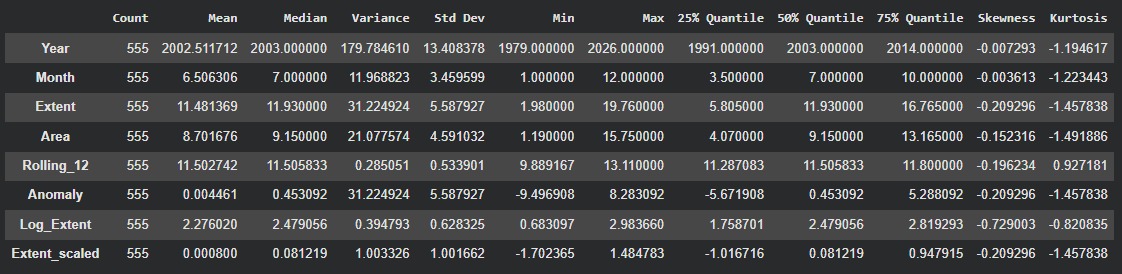
The Antarctic sea ice dataset contains 555 observations, with average Extent ≈ 11.48 million km² and Area ≈ 8.70 million km², showing moderate variability but relatively symmetric distributions (skewness near 0). The engineered features (Rolling_12, Log_Extent, and scaled values) stabilize variance and highlight longer-term trends and anomalies in sea ice extent over time.
Climate Data Online (API)
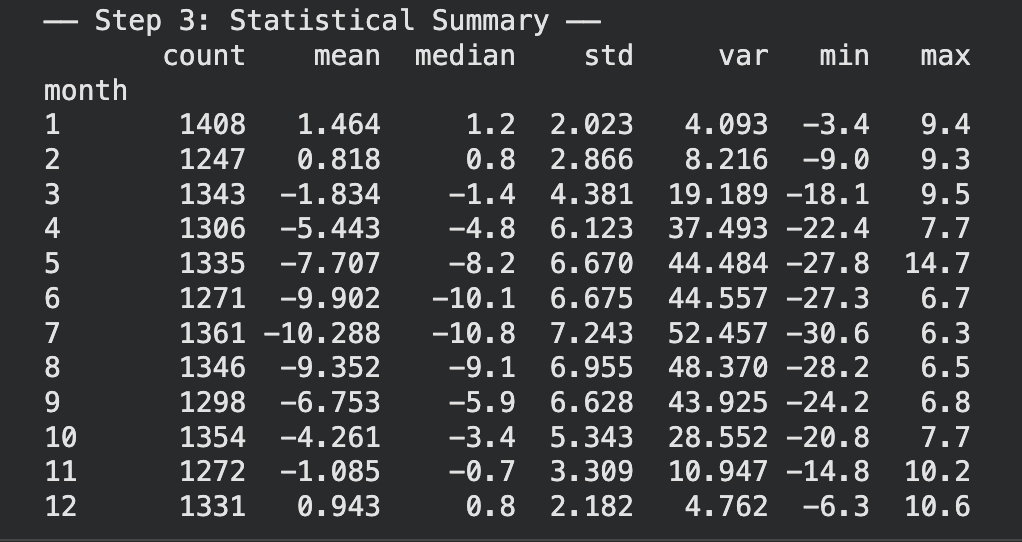
The statistical summary provides descriptive statistics of temperature values grouped by month. The results show clear seasonal patterns in the data. Average temperatures are highest during the winter months (January, February, and December), with mean values around 0.8–1.46°C, while the coldest temperatures occur in the summer months (June–August), where the mean drops to approximately −9°C to −10°C. The standard deviation is larger during the colder months, indicating greater variability in temperature during that period. The minimum and maximum values also highlight extreme temperature observations, with the lowest recorded temperature reaching around −30.6°C in July and the highest reaching about 10.6°C in December. Overall, the summary demonstrates strong seasonal temperature variation throughout the year.
Correlation Analysis
Antarctic penguin population database
Annual totals reveal a strong positive correlation between King and Macaroni penguins (r=0.918), suggesting they may respond similarly to environmental changes. In contrast, Gentoo penguins show no significant correlation with either species, indicating distinct population dynamics.
4. Visualizations
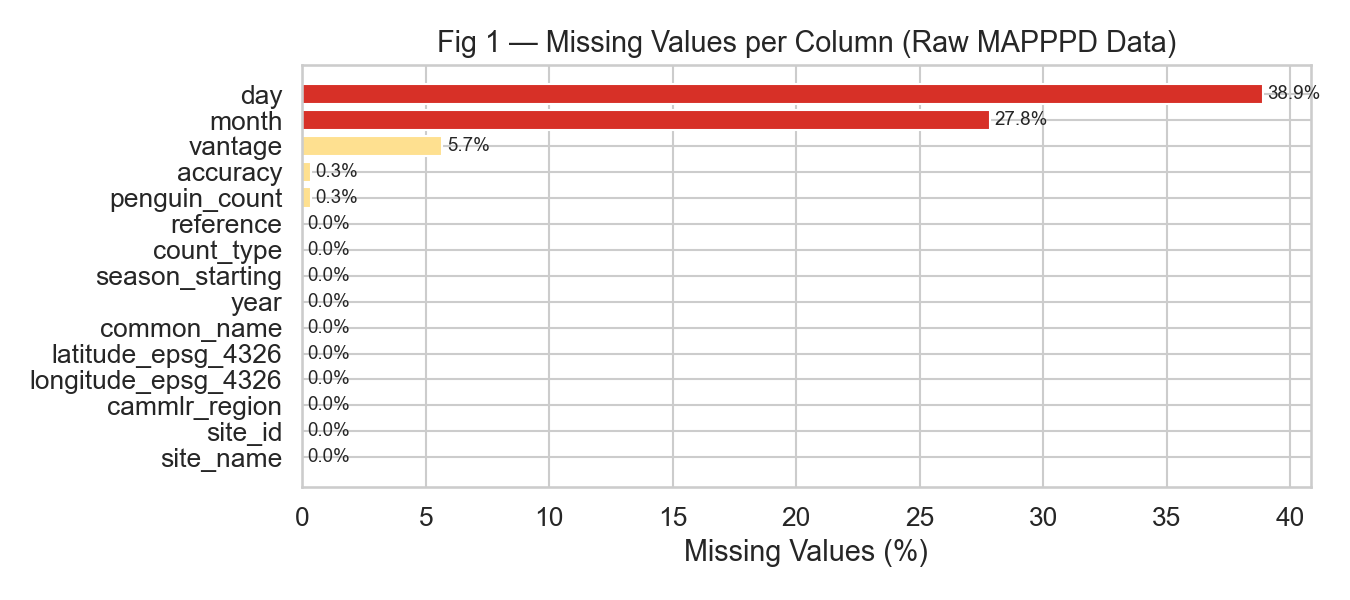
Insight: Day and month columns had the highest missingness (38.9% and 27.8% respectively); month was imputed using breeding season norms by count type, while day was left as-is since it is not used in the analysis.
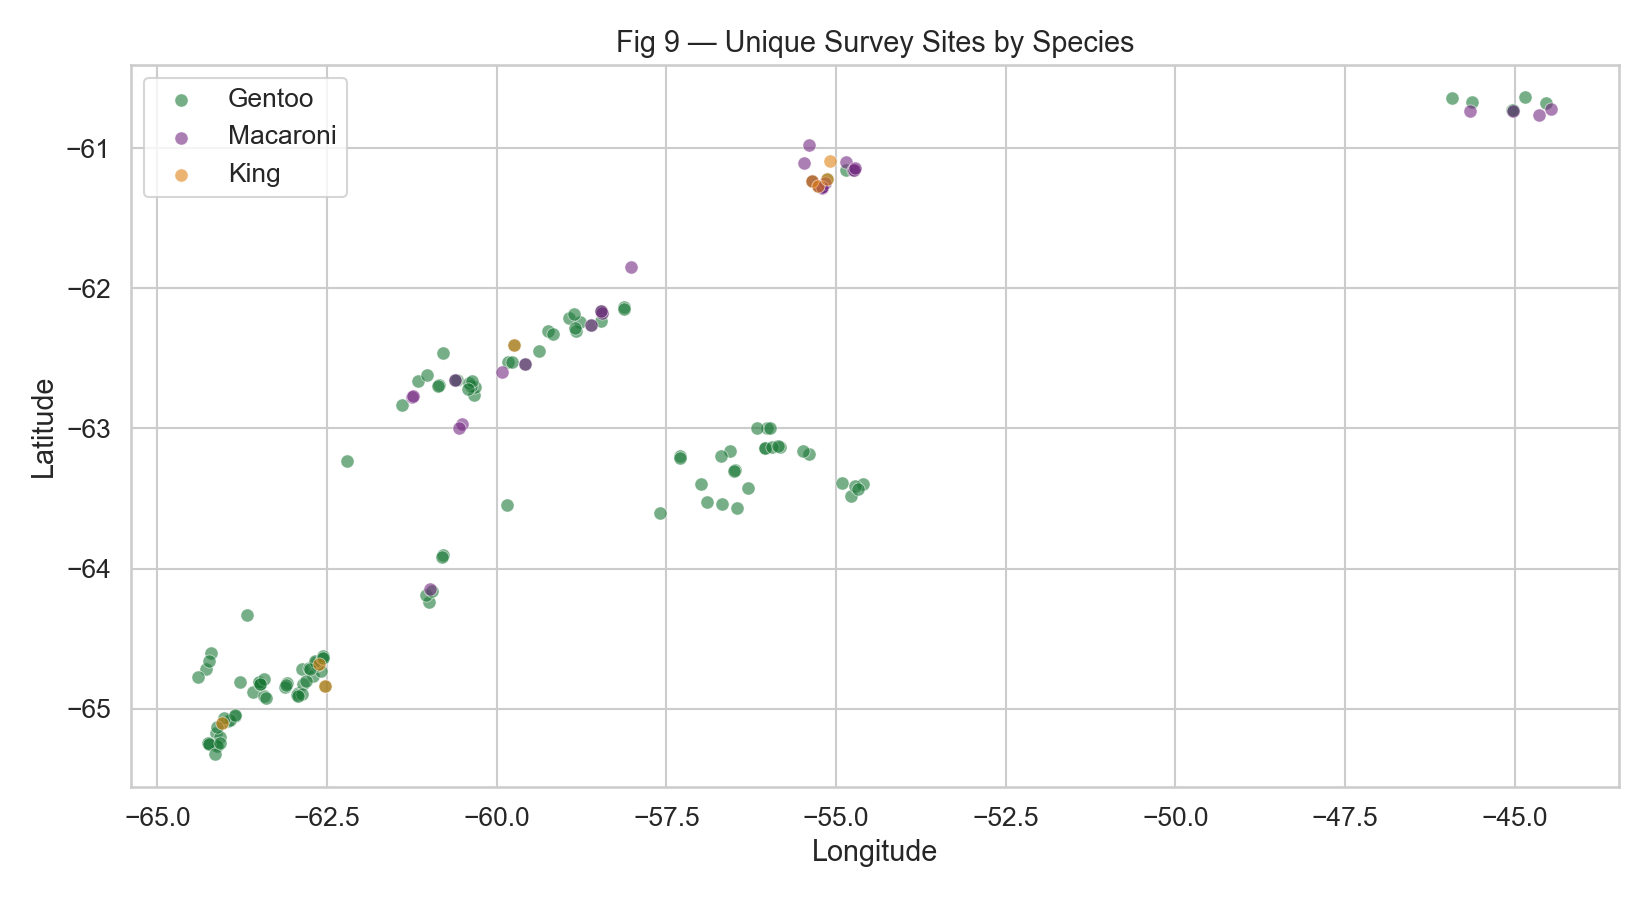
Insight: Survey sites are heavily concentrated in the sub-Antarctic islands (South Georgia, Falklands, Kerguelen) with Gentoo covering the widest geographic spread, while King and Macaroni sites cluster in a narrower latitudinal band.
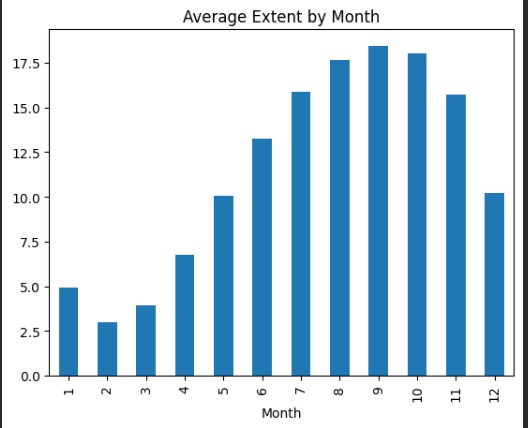
Insight: Shows seasonal and interannual variability, with general trends in ice extent. Peaks in austral winter, troughs in summer, highlighting long-term patterns and variability.
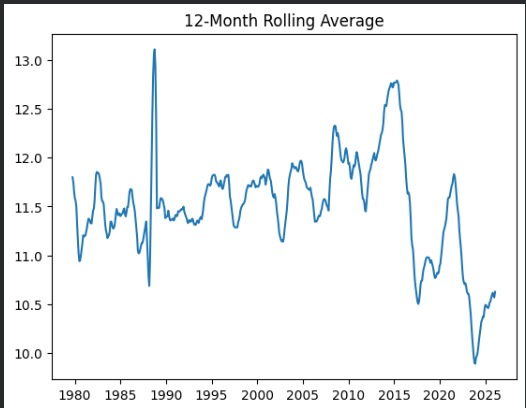
Insight: The 12-month rolling average shows long-term variability in Antarctic sea ice extent, with relatively stable levels until the mid-2010s followed by a noticeable decline after 2016. Recent years show partial recovery but values remain lower than earlier historical peaks.
![[ Fig 5 — QQ Plots ]](DataCleaning_and_Preprocessing/Ishita_Penguin/Penguin_plots/fig05_qq_plots.png)
Insight: QQ plots assess normality of log-count. Note deviations at tails
![[ Fig 5 — QQ Plots ]](images/Screenshot 2026-03-06 at 4.15.02 PM.png)
Insight: Adélie shows the largest spikes and highest totals, while Chinstrap has occasional sharp peaks and Emperor stays comparatively low. The many near-zero years suggest uneven sampling/coverage over time (data gaps), so trends should be interpreted with caution.
![[ Fig 5 — QQ Plots ]](images/Screenshot 2026-03-06 at 4.15.27 PM.png)
Insight: Adélie’s distribution is shifted to the right, meaning it generally has higher counts than Chinstrap, while Emperor is concentrated at lower values. All three are right-skewed, indicating a few very large colonies/outlier counts drive the upper tail.
![[ Fig 5 — QQ Plots ]](images/Screenshot 2026-03-06 at 4.15.45 PM.png)
Insight: High-intensity bands appear mostly for Adélie across multiple years, showing consistently higher average counts compared to the other species. Large dark regions indicate years with missing/low observations, highlighting that availability of surveys varies by year and species.
![[ Fig 9 — Seasonal Temperature Cycle in Antarctica ]](images/Linh_fig01_monthly_timeseries.png)
Insight: The chart shows a strong seasonal temperature cycle throughout the year. Temperatures are highest during the Antarctic summer months (December–January), reaching around 1–1.5°C, and steadily decrease toward the winter months (June–July) where the average temperature drops to around −10°C. After July, temperatures gradually rise again as the region moves back toward summer. This pattern highlights the expected seasonal climate behavior in polar regions, with long, cold winters and short, relatively warmer summers.p.
![[ Fig 10 — PCA Scatter ]](DataCleaning_and_Preprocessing/Ishita_Penguin/Penguin_plots/fig10_pca.png)
Insight: how well species cluster in reduced feature space.
![[ Fig 11 — Monthly Temperature Anomalies Over Time (1979–Present) ]](images/Linh_fig3_anomalies.png)
Insight: The anomaly plot shows temperature deviations from the long-term monthly average between 1979 and the present. Values fluctuate above and below zero, indicating periods that were warmer or colder than typical conditions for that month. While short-term variability is evident, recent years show more frequent positive anomalies, suggesting a tendency toward warmer-than-average temperatures in recent decades. These fluctuations illustrate both natural climate variability and potential long-term warming signals.
Each dataset has generated 10 visualizations. However, on the website, we only show 11 visualizations in total for representation purpose.
5. Before / After Data Quality
Antarctic penguin population database
![[ Fig 12 — Before vs After grouped bar chart ]](DataCleaning_and_Preprocessing/Ishita_Penguin/Penguin_plots/fig12_before_after.png)
The raw 3-species dataset contained 1,707 rows with duplicates, zero counts, and pre-systematic-coverage records; after cleaning, 1,174 high-quality records remain with imputed months, flagged outliers, and derived features including log count, decade, and normalized scores.
Antarctic Sea Ice Extent
![[ Fig 12 — Before vs After grouped bar chart ]](images/Sea_Ice_b4_After.jpeg)
![[ Fig 12 — Before vs After grouped bar chart ]](images/Sea_Ice_extent_Before.jpeg)
Antarctic Penguin Population Database
![[ Fig 12 — Before vs After grouped bar chart ]](images/Screenshot 2026-03-06 at 4.42.09 PM.png)
Climate Data Online
![[ Fig 12 — Before vs After Data Cleaning/Processing ]](images/Linh_fig_structure_before_after.png)
Several unnecessary columns were removed to simplify the dataset, and new derived features including temperature z-scores and monthly temperature anomalies were added to support further analysis.
6. Ethics, Bias & Limitations
Antarctic penguin population database
Geographic Bias
Survey sites in the MAPPPD dataset are heavily concentrated around established research stations and accessible sub-Antarctic islands such as South Georgia, Kerguelen, and the Falklands — Gentoo's 1,096 records reflect this bias, while King penguin's 11 records highlight how remoter breeding sites remain largely unmonitored. This uneven coverage means population trends may better represent well-studied colonies than the species as a whole.
Temporal Coverage Gaps
King penguin is severely underrepresented with only 11 clean records across the 1979–2025 window, making any trend interpretation for that species unreliable. Macaroni penguin coverage also thins considerably before the 1990s, which may distort long-term decline estimates if early baseline counts are missing.
Measurement Uncertainty
MAPPPD's accuracy field (scale 1–5) was retained in the dataset but not used to filter records, meaning lower-confidence estimates from satellite or aerial surveys are weighted equally alongside precise ground counts. Future analysis should consider filtering to accuracy ≥ 3 or weighting records by accuracy to reduce noise in trend modeling.
Species Scope
This analysis covers only Gentoo, King, and Macaroni penguins, leaving out Adélie, Chinstrap, and Emperor species that are also present in the MAPPPD dataset and ecologically significant. Conclusions about Antarctic penguin population health cannot be generalised beyond these three species without expanding the dataset.
Ethical Considerations
Data is sourced from the Antarctic Penguin Biogeography Project (APBP) and distributed through MAPPPD under a CC-BY 4.0 open-access license, requiring attribution to Che-Castaldo, Humphries, and Lynch. This data directly informs CCAMLR conservation policy and krill fishing regulations, so responsible use means avoiding overstatement of trends given known data gaps, and ensuring any published findings credit the original field researchers whose decades of survey work underpin the dataset.
Climate Data Online
Geographic Bias
The dataset represents temperature measurements from one specific monitoring stations in Antarctica - Base Esperanza station, which may not fully represent temperature conditions across the entire continent. Some regions have limited or no observational coverage, meaning the data may reflect conditions only in monitored areas rather than the entire Antarctic climate.
Measurement and Instrument Limitations
Temperature measurements rely on weather station instruments, which can be affected by calibration differences, equipment malfunctions, or environmental interference. Although NOAA applies quality control procedures, measurement errors may still occur and introduce minor inaccuracies in the dataset.